
Excel vs. IgPet. An informal geochemistry plotting showdown
Published:
Note from present day Thi (February 2024): This software/data narrative about my dissertation work was written in 2022 just a few months before I completely switched over to using R. Fascinating stuff.
Today I attempted to solve the problem of streamlining geochemical compilations with Excel and IgPet. I prioritize traceability and reproducibility, so while it may be easy to generate a cloud of data points that is vaguely related to a reference, I prefer to keep the data as complete as possible, because I foresee several edits in my future.
I have a penchant for the program IgPet to make geochemical figures because of the ease of generating bivariate plots with minimal steps. On the superficial side, I like the default appearance of the plots. On the practical side, IgPet brings me closer to the goal of learning tidy data, which is more consistent with good programming practices.
I am aware that scientists are using Microsoft Excel beyond the intended purpose to display accounting data. It makes sense that, while, “data processing”, calculations, visualizations, etc., can be done on Excel, that does not mean that we should. But sometimes I wonder if my Excel use is needlessly haphazard, random, and unorganized, despite the fact that I know how to use macros, pivot tables, etc. Perhaps the difficulties are mine alone, and I can work towards being more organized while documenting my workflow and issues.
Today, I will be overly organized and document my steps to compare how one graduate student makes plots with Microsoft Excel and with IgPet.
Objective
Make a simple “mantle components” isotope diagram from Stracke et al. (2012). The paper contains figures showing such components, but no straightforward single value or data table for say, averages, etc. My simple goal is to create an 87Sr/86Sr-143Nd/144Nd plot where the 25 groups are shown with different symbols.
The Showdown
I have a primary Windows laptop that I use for dissertating (LaTeX, Zotero), data processing (Excel, sometimes play around with Python and SQL), and general use. I will use this for the Microsoft Excel part, and the data processing for IgPet.
I also am borrowing a MacBook Pro from my department, solely to use the program IgPet, for which my research group has a Mac OS X site license, but not one for Windows. I do all of the data processing, organization, collating on the Windows, and simply generate figures on the Macbook. I am still considering paying the $300 fee for a Windows site license, because you’ll come to see the my brain can only tolerate a small level of things-being-in-several-places before I start to forget they exist, or that I was searching for those things to begin with.
Microsoft Excel
Disclaimer: I acknowledge there are probably much more streamlined ways to do this, however, this process is likely to be a frequent one for me, even if I accomplish more efficient means in the future.
Data
- I go to the Supplementary Table 1 on the science direct page. I downloaded the spreadsheet which is an xls file. I save it with the default name, “1-s2.0-S000925411200366X-mmc1.xls”. It goes into “My Downloads” folder on Windows, since it’s easier for me to rename and move later rather than get this sorted upon download (maybe I dislike working in tiny dialog boxes…)
- I moved the file to Hawaiian Literature–> Supplementary Data Files–>rename to Stracke2012-supp-table-1. I almost got lost trying to find “open in new window” option in the huge Windows right click toolbar. There must be 3 dozen options in that toolbar.
- I open the file and see that Table 1 shows 2 tabs: “Data” and “References”. I will duplicate “Data” and then rename former to “Data (original)”, “References (original)”.
- I work in “Data” tab, knowing that the original data is also within reach, if needed.
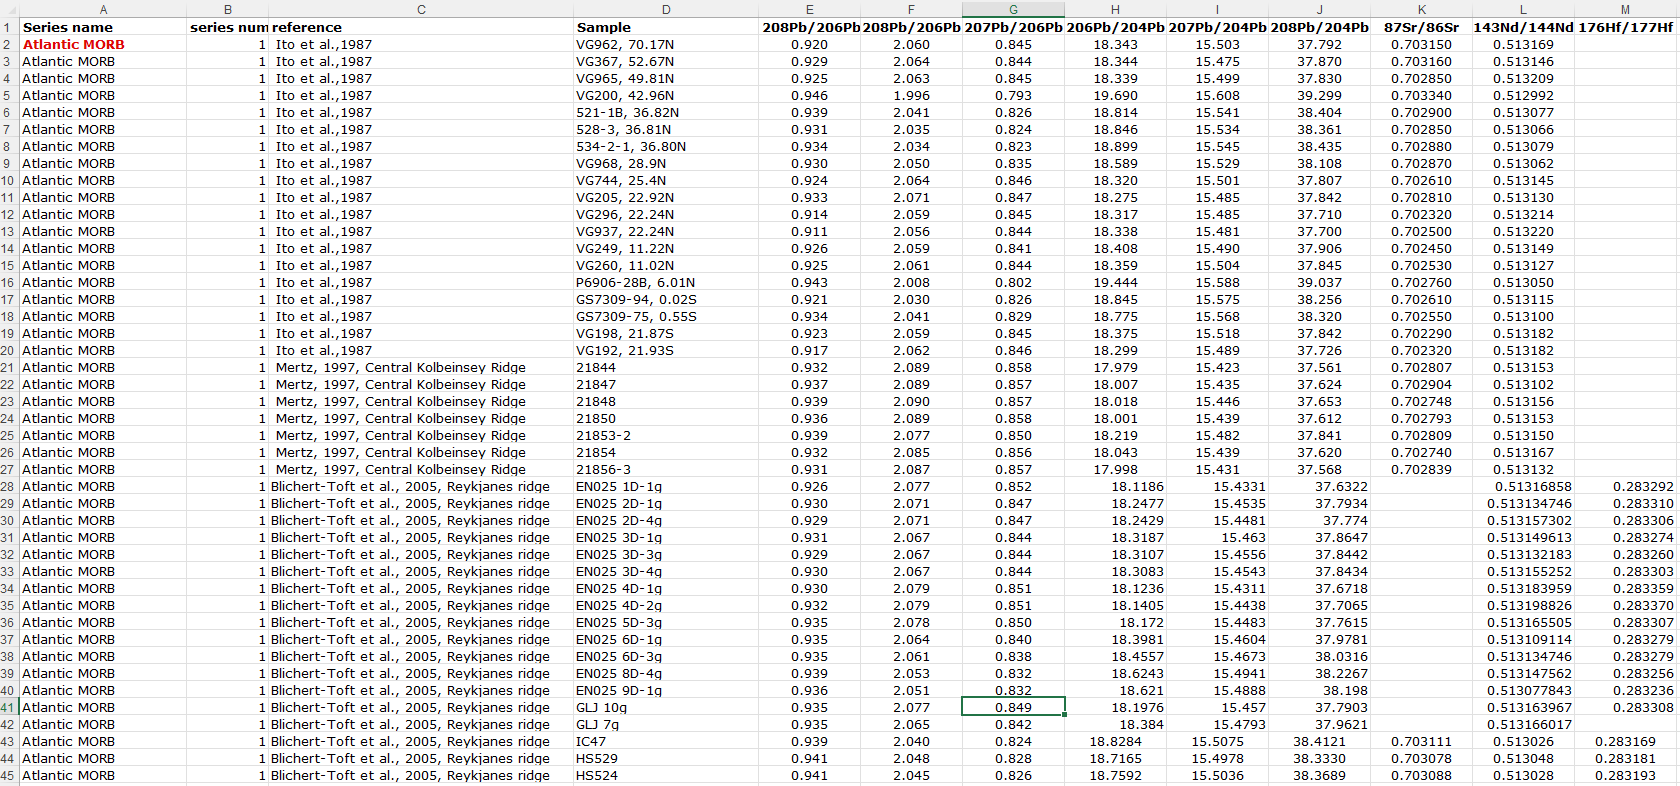
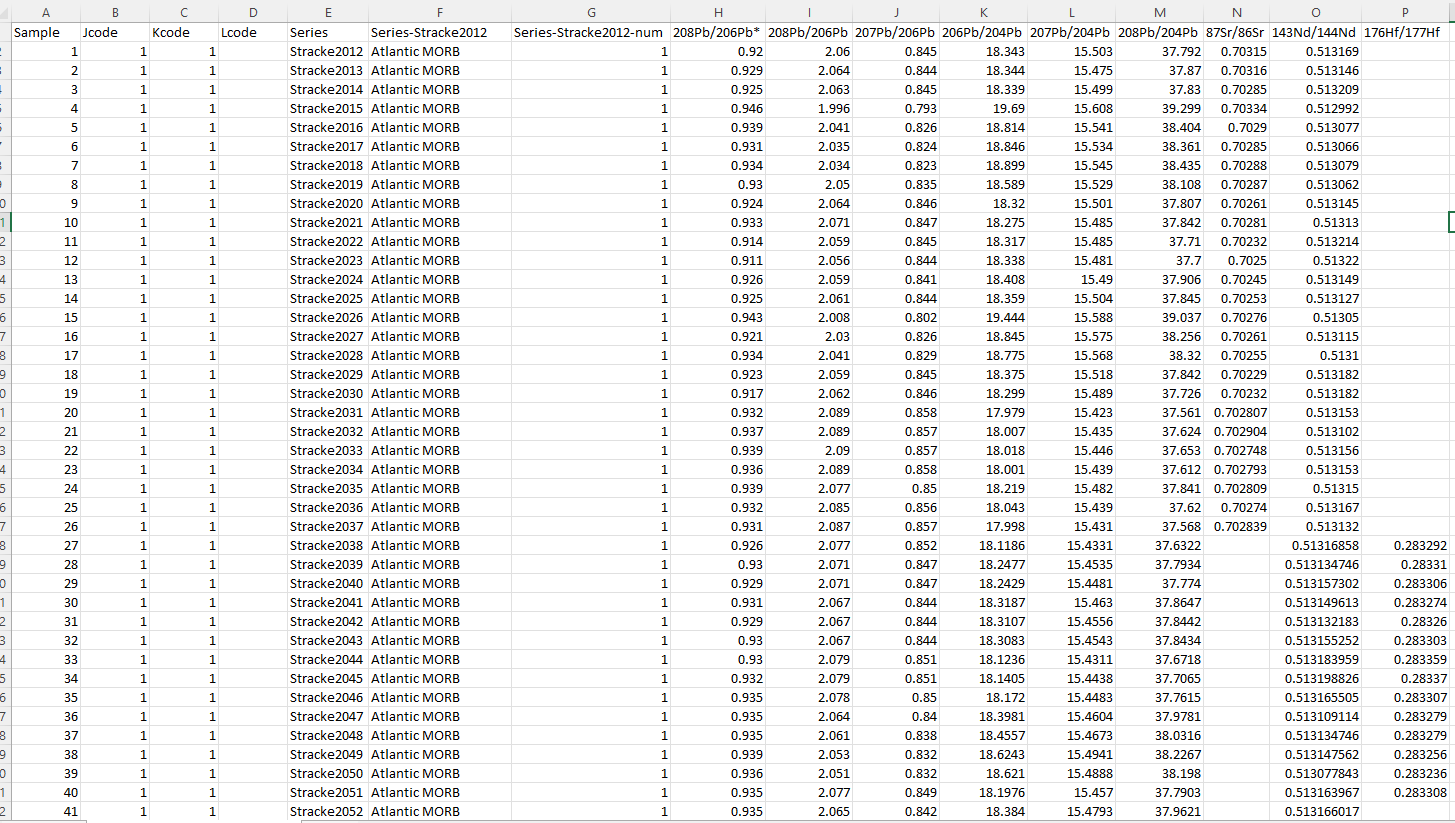
- I inspect the data sheet to see what I am working with.
- I want to produce a sheet where every row/column is a value, so I look for remove columns that are not needed. I end up deleting C and D because they are not numerical and will not be useful when plotting (not to worry, the data still lives in the other tab, “Data (original)”.
- I assigned unique number values into leftmost column. There is probably a better way to do this, but I have them as 1 to 4939. I also freeze paned first column and row for ease of looking at the data.
Plotting
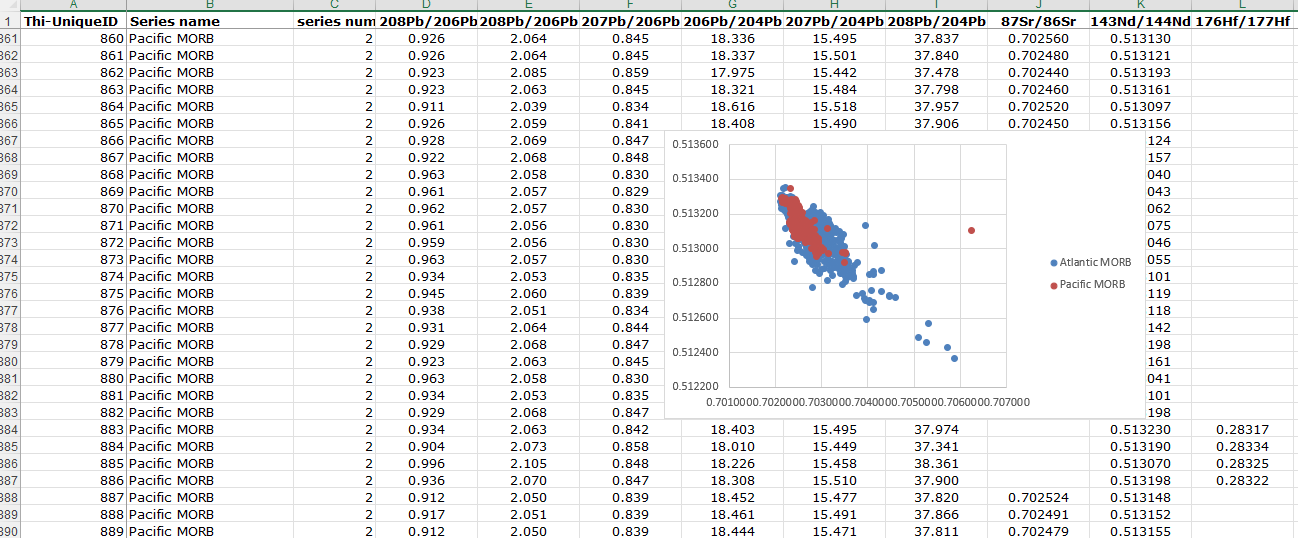
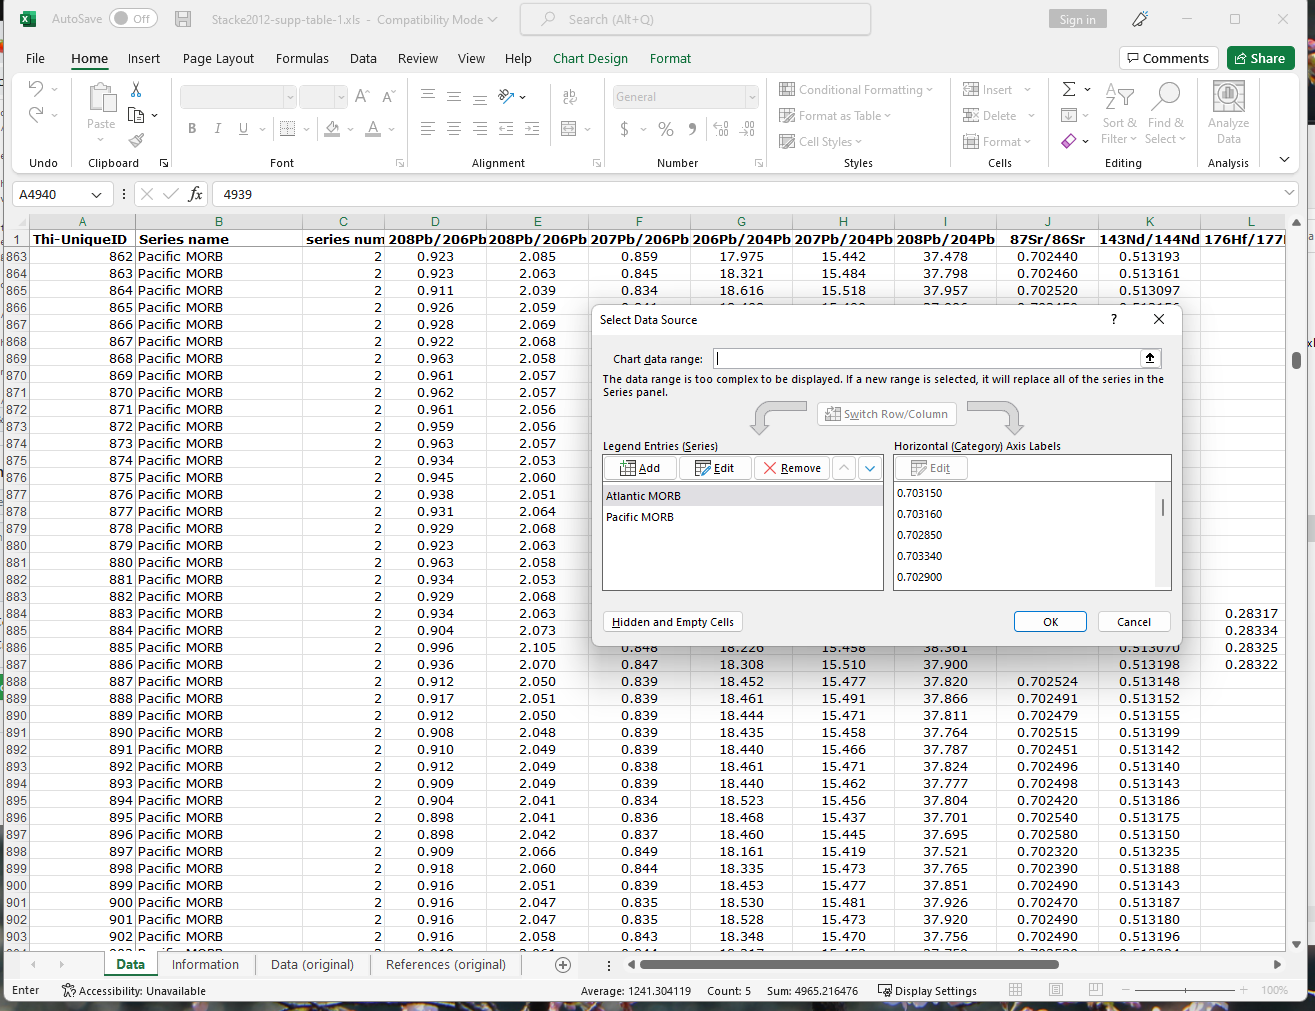
I experiment with making an Sr-Nd plot that has all the series with correct names. I make the first one for Series 1 and 2 by manually dragging the “Select data” tool to the spreadsheet, opposed to typing them into the fields. Atlantic and Pacific MORB are shown here. I am reminded by how easy it is to lose this plot when scrolling.
Really tedious data steps that aren't even worth looking at (Click to expand)
- For the rest, I want to semi-automate it by changing the data cell numbers (rows). I may manually select the locality names but we'll see. The pair of plots-in-progress in Excel are that I never know where to find them within the sheet when I am done selecting the data. This plot sits in the rows where presumably, the last series group starts. At least I think that's the logic. Still tough in a nearly 5,000 row sheet. I do not make the plot in anew tab because of aforementioned object permanence issues, but maybe soon I can do that.
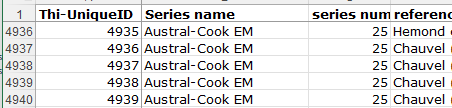
- There are almost 5,000 values in this sheet, so I wanted to see if I could streamline grouping everything without turning it all into a table. I learned how to jump to unique values (start of 1, end of 1 or start of 2, end of 2 or start of 3... by highlighting column C and pressing CTRL + SHIFT + \. The only problem is that has to be done from the beginning every time. How can you highlight a column but in the middle? You can't! Okay it's faster to just copy the first 3 rows and add 1 to the leftmost row later.
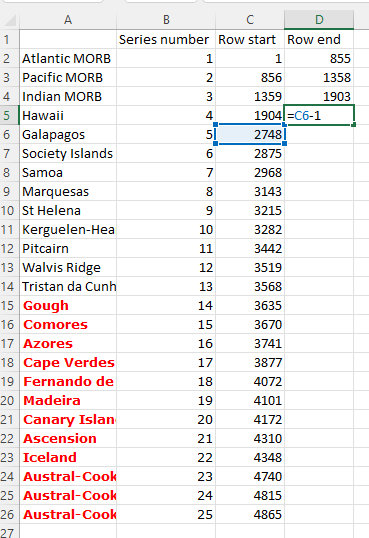
- I start compiling a list in another Excel sheet that shows the series name, series number, and the rows associated with each one (25 in total).
- For series 1-5, I wrote them all out. For 7, I thought, oh I could just copy and paste and still use the keyboard shortcut. but that spit me out to the beginning. So I just went through the whole thing again with the keyboard shortcut. By the time I got to 13, I decided to just manually scroll through the rows, spot new series numbers, and simply copy and paste the rows, and add 1 later to each number in the leftmost column. Making progress on the table.
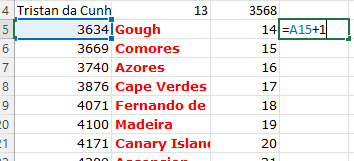
- Though I could easily pull down the formula to easily calculate the rest up to row 26, I had to delete the first row without compromising the latter. So I copied the new calculations and pasted into a new column, then replaced the calculation column so that I could safely delete the stuff in column A without causing errors.
- Next step was to fill in column D "Row End" with the next row start minus 1, to get the correct row end values. I had to type out "4940" for the last one, or else it was -1. Nuances of pulling through Excel calculations.
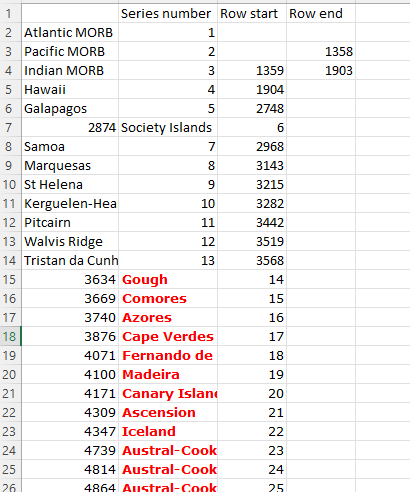
- I had been doing this all in another sheet solely so that I could have windows side by side. This is way easier than navigating tab-to-tab within one sheet (I get lost easily and forget what I was doing). To keep a record of my work here, I insert the series number/row start/row end info as plain text in a new tab "Information".
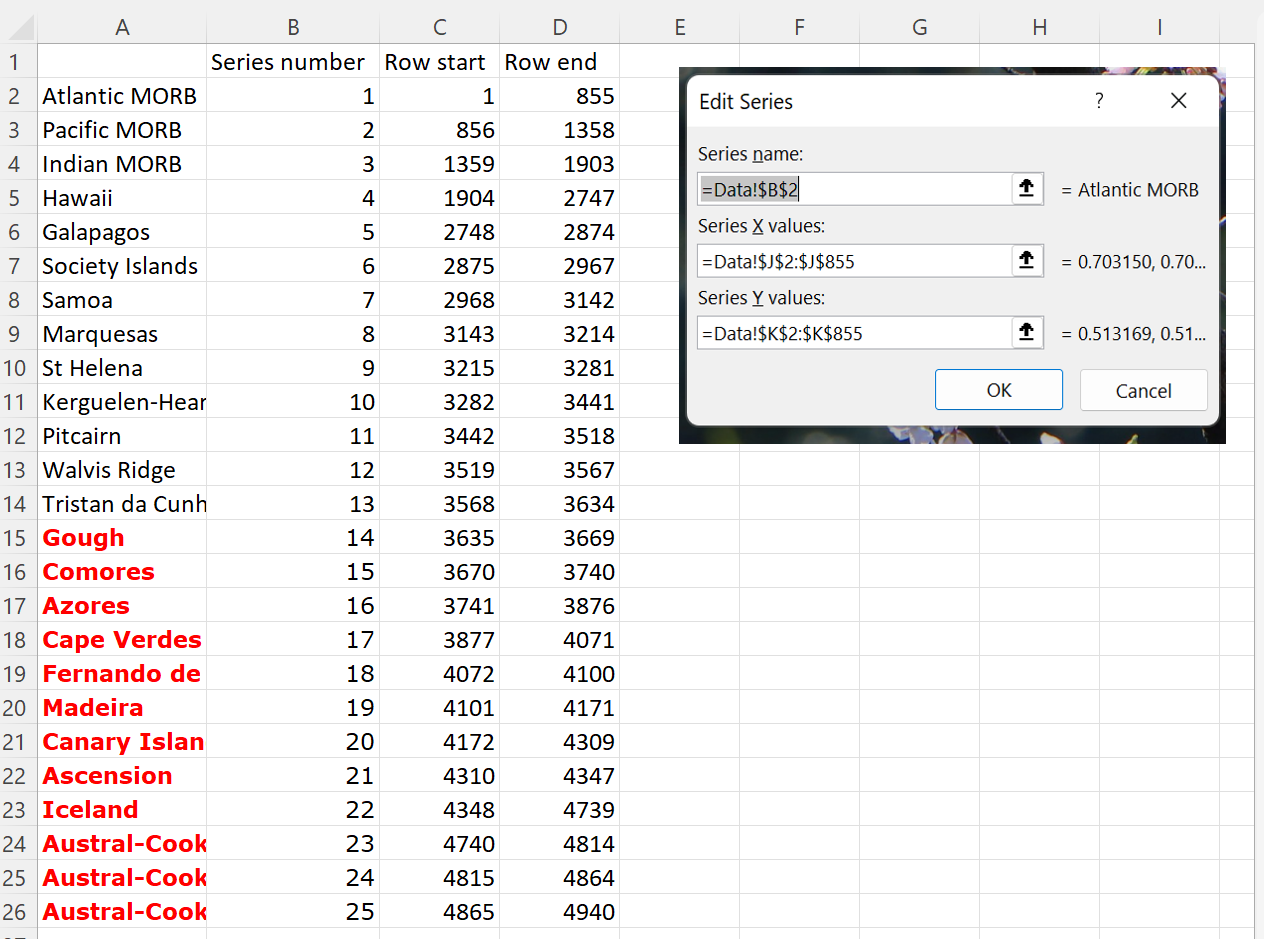
- I did a random check with series 7 Samoa and series 22 Iceland to make sure the row start and ends are correct, and indeed they are. The series numbers all match up with where they are supposed to, so that is reassuring. You can see the product of my hard work in the right screen picture below.
- Now that I know the "formulas" and have things set up, I determine that my most efficient system involves working on two screens, where the left screen is the large external monitor where the Excel action happens. and the right screen is my laptop, where the information is kept in sequential order.
- I tried to challenge myself to see if I could plot the rest of the 23 groups in the Sr-Nd plot in 5 minutes. That did not work. You can't really streamline manually adding a group to plot in the "select data" function. It's all one-by-one.
20 minutes later, I have made progress because I actually pre-wrote all the formulas on a separate notepad file to paste, one by one, into the Excel fields.
Urgh, why is this happening? All the Canary Island values are fine and not acidentally off by orders of magnitude…
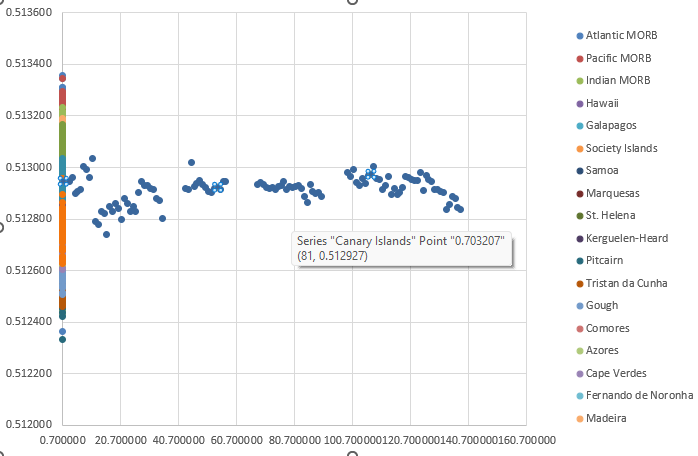
This is what happens when you plot Canary Islands alone…
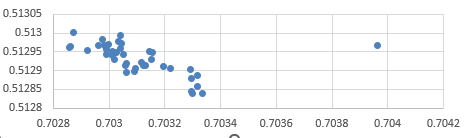
I have no patience for this, so I deleted the Canary Islands. Sorry. This is the Sr-Nd plot:
Now I am wondering if I even set myself up at all to plot Pb-Pb-Pb plots with this system. I think I still have to go group by group (all 25) and painstakingly replace the column letters!
IgPet
Data
I copied and pasted all the data into a new sheet, and I made sure to have first column renamed to “Sample”, and then include the JCode, KCode, and LCode columns to create the working tab delimited text file. I do not have symbols or legend codes figured out yet, but this should plot okay.
Conveniently, the excel file where I tracked the series number will be useful because I can actually make the legend very quickly in notepad, in a .txt file, and I use those numbers as both KCode and JCode.
Plotting
I go over to the MacBook which I always put to sleep, so turning it on takes about 10 seconds.
I have a Dropbox document folder synced up, though it’s not the SAME IgPetDocs folder as on the Macbook, becuase I am still not sure how these things work. It’s still an instantly transferrable file, even if I have some not-super-matching redundant folders.
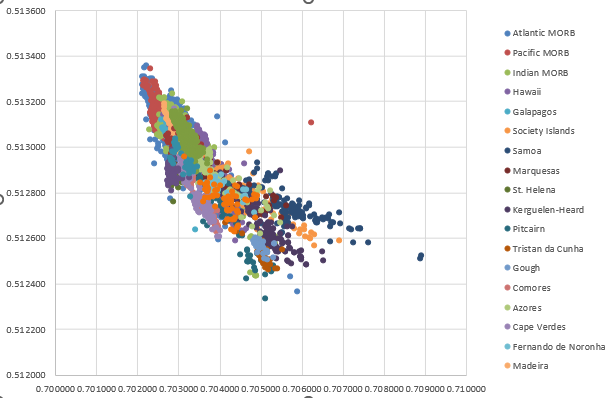
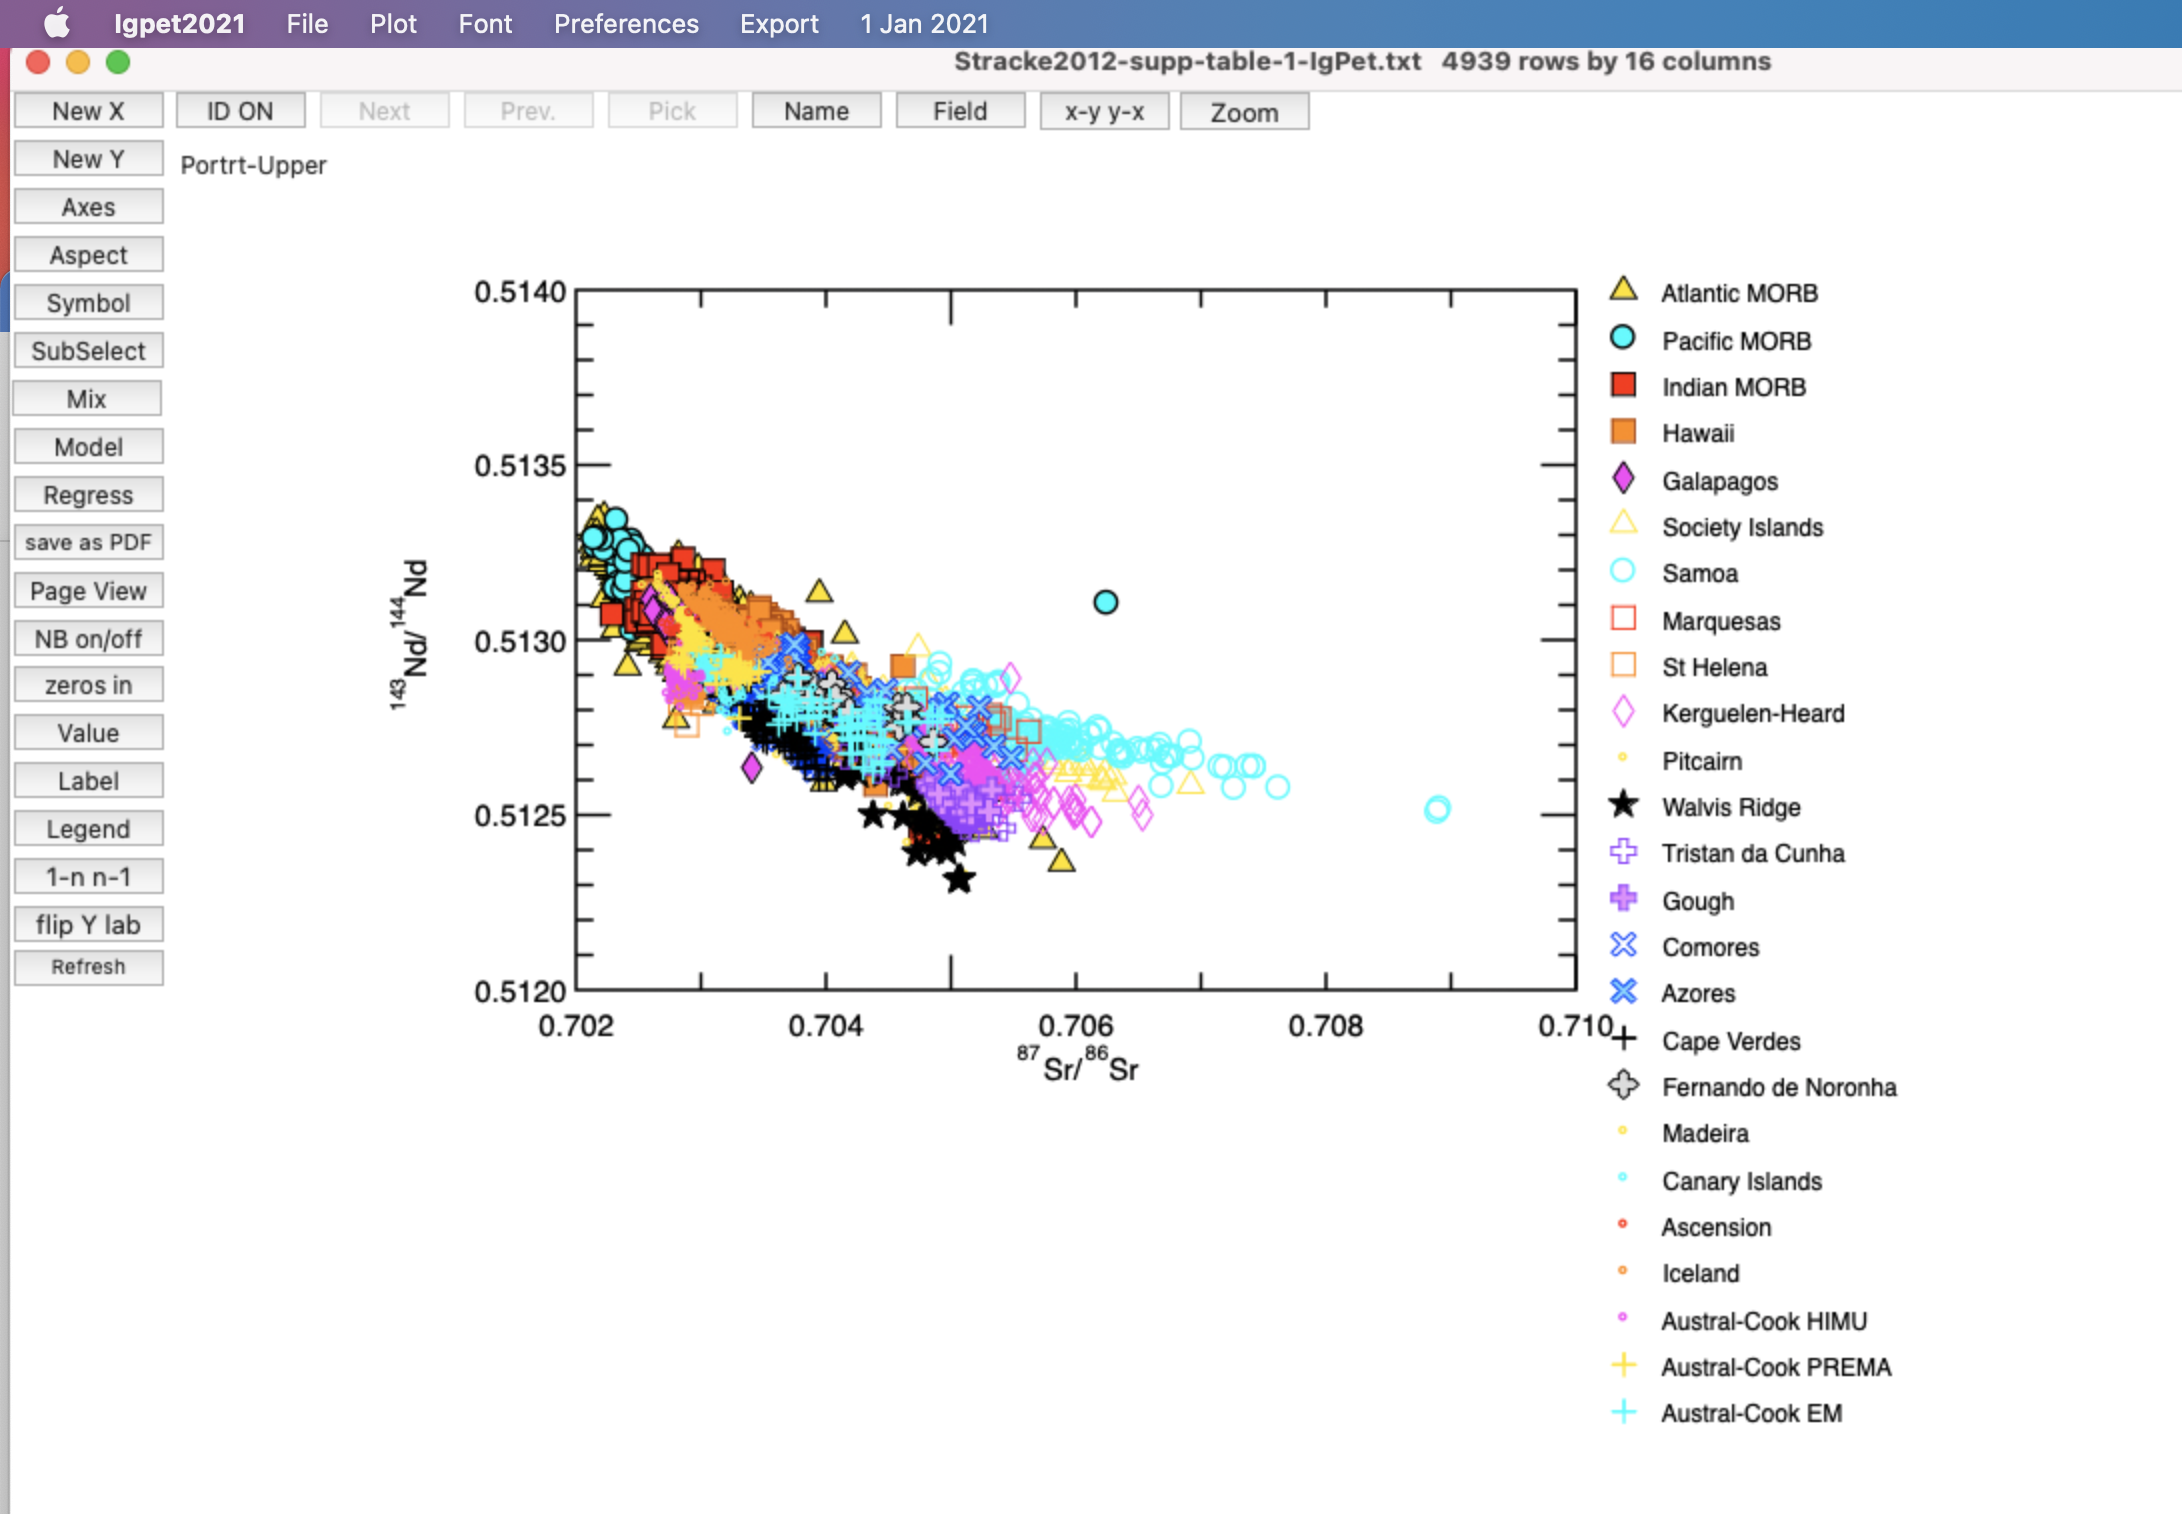
I open IgPet, load the .txt file I just made, and make an X-Y plot where I select 87Sr/86Sr Nd first, and then 143Nd/144Nd second. I select the legend .txt file that I just made. I generate this in about a minute:
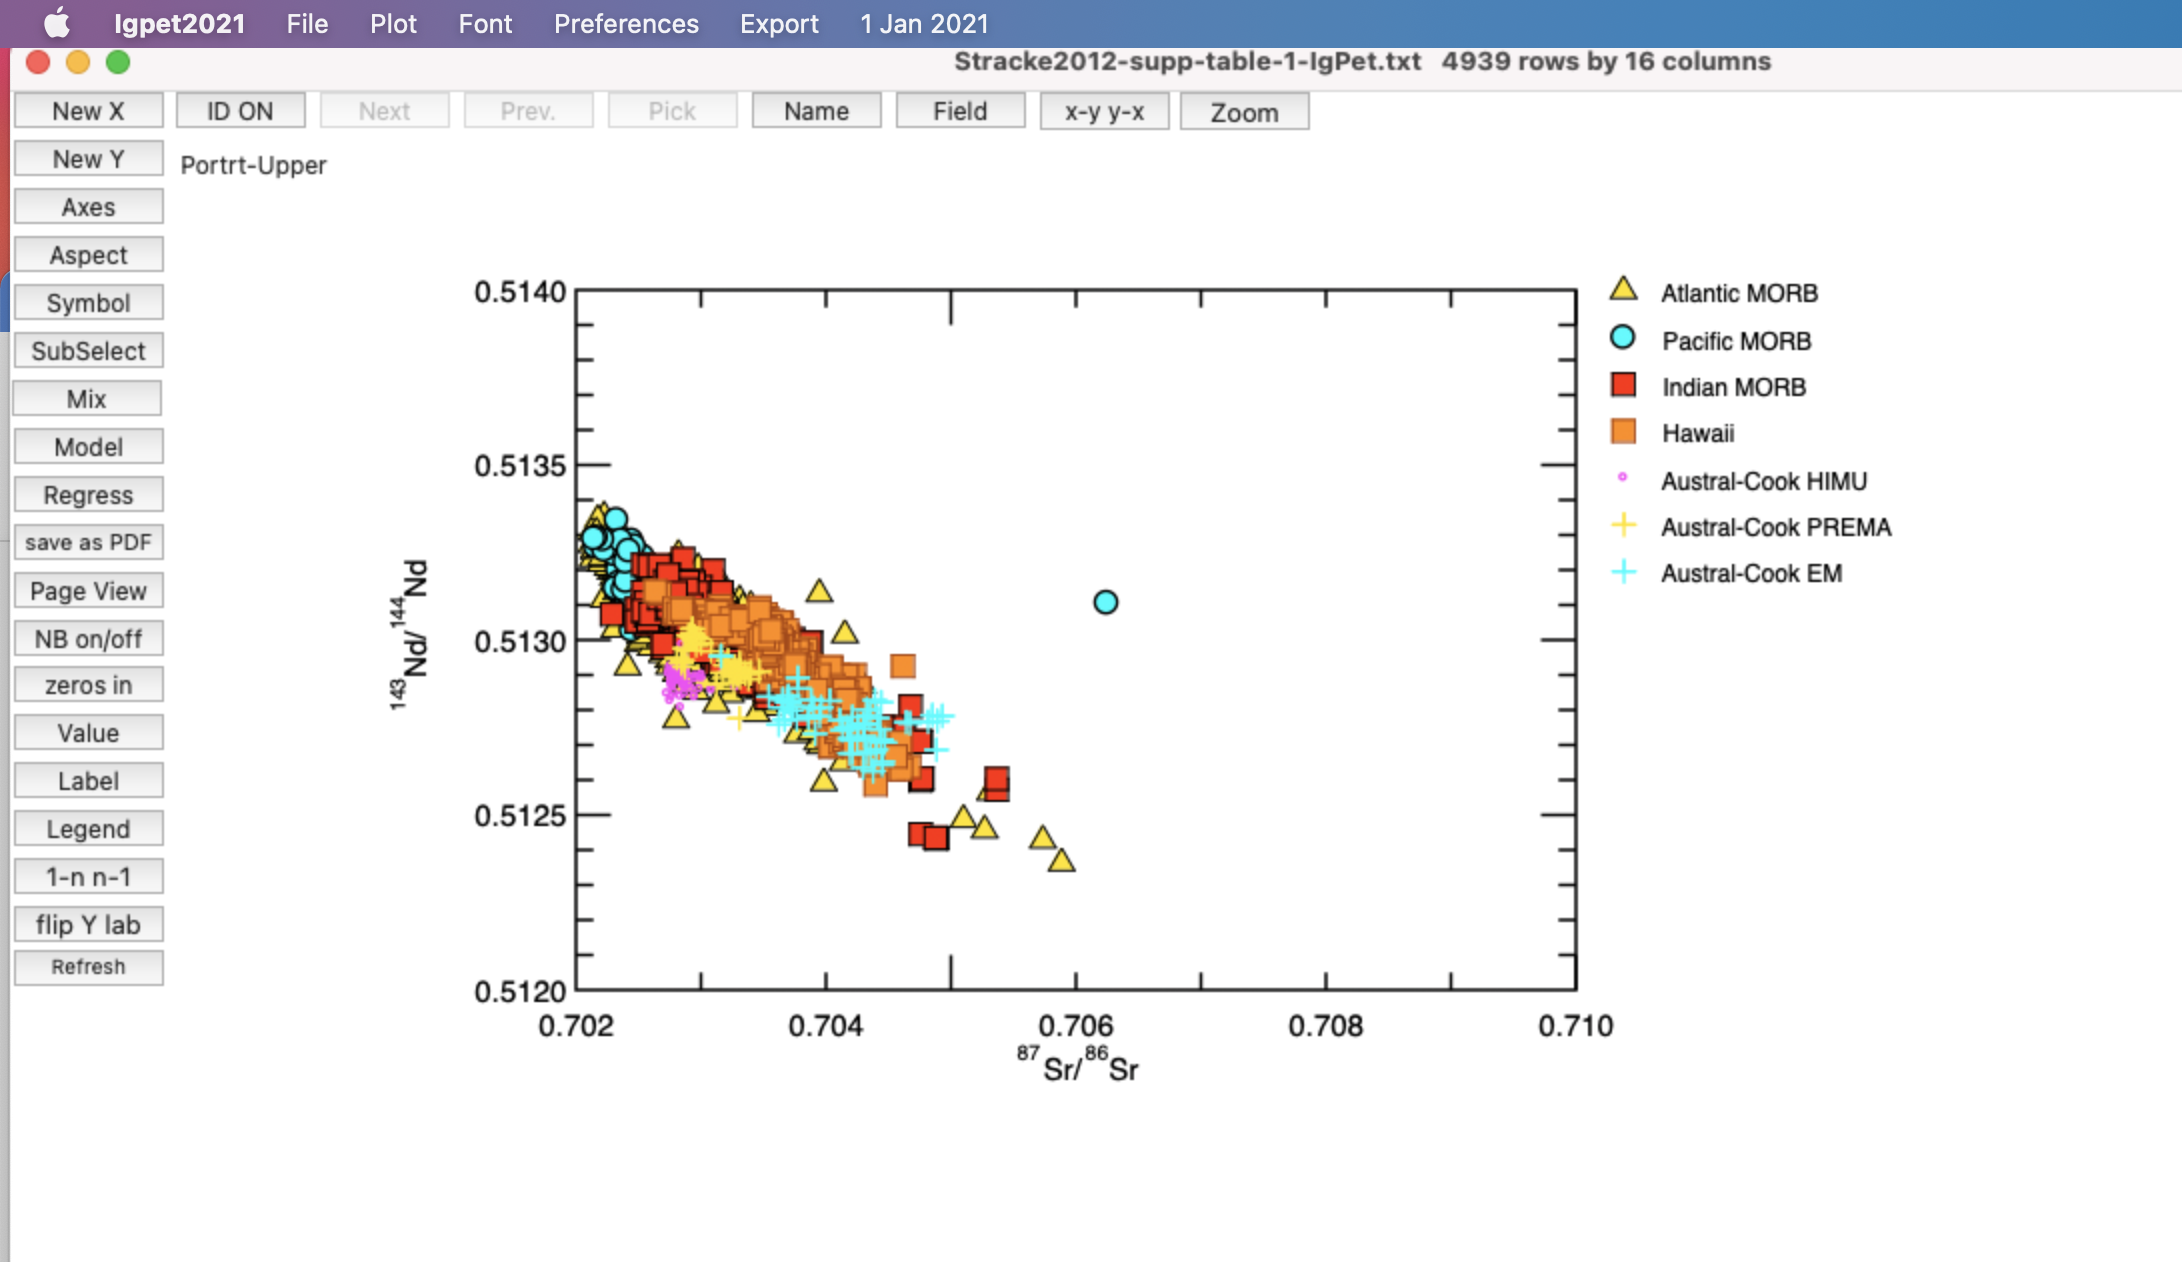
I also experiment with making plots that only show MORB, Hawaii, and the Austral-Cook endmembers. This requires a bit of self-referencing to know that 1 = Atlantic MORB, 2 = Pacific MORB, etc., but I have the numbers written out, so it is easy enough to reference. I use the subselect tool, and this is the resulting Sr-Nd plot:
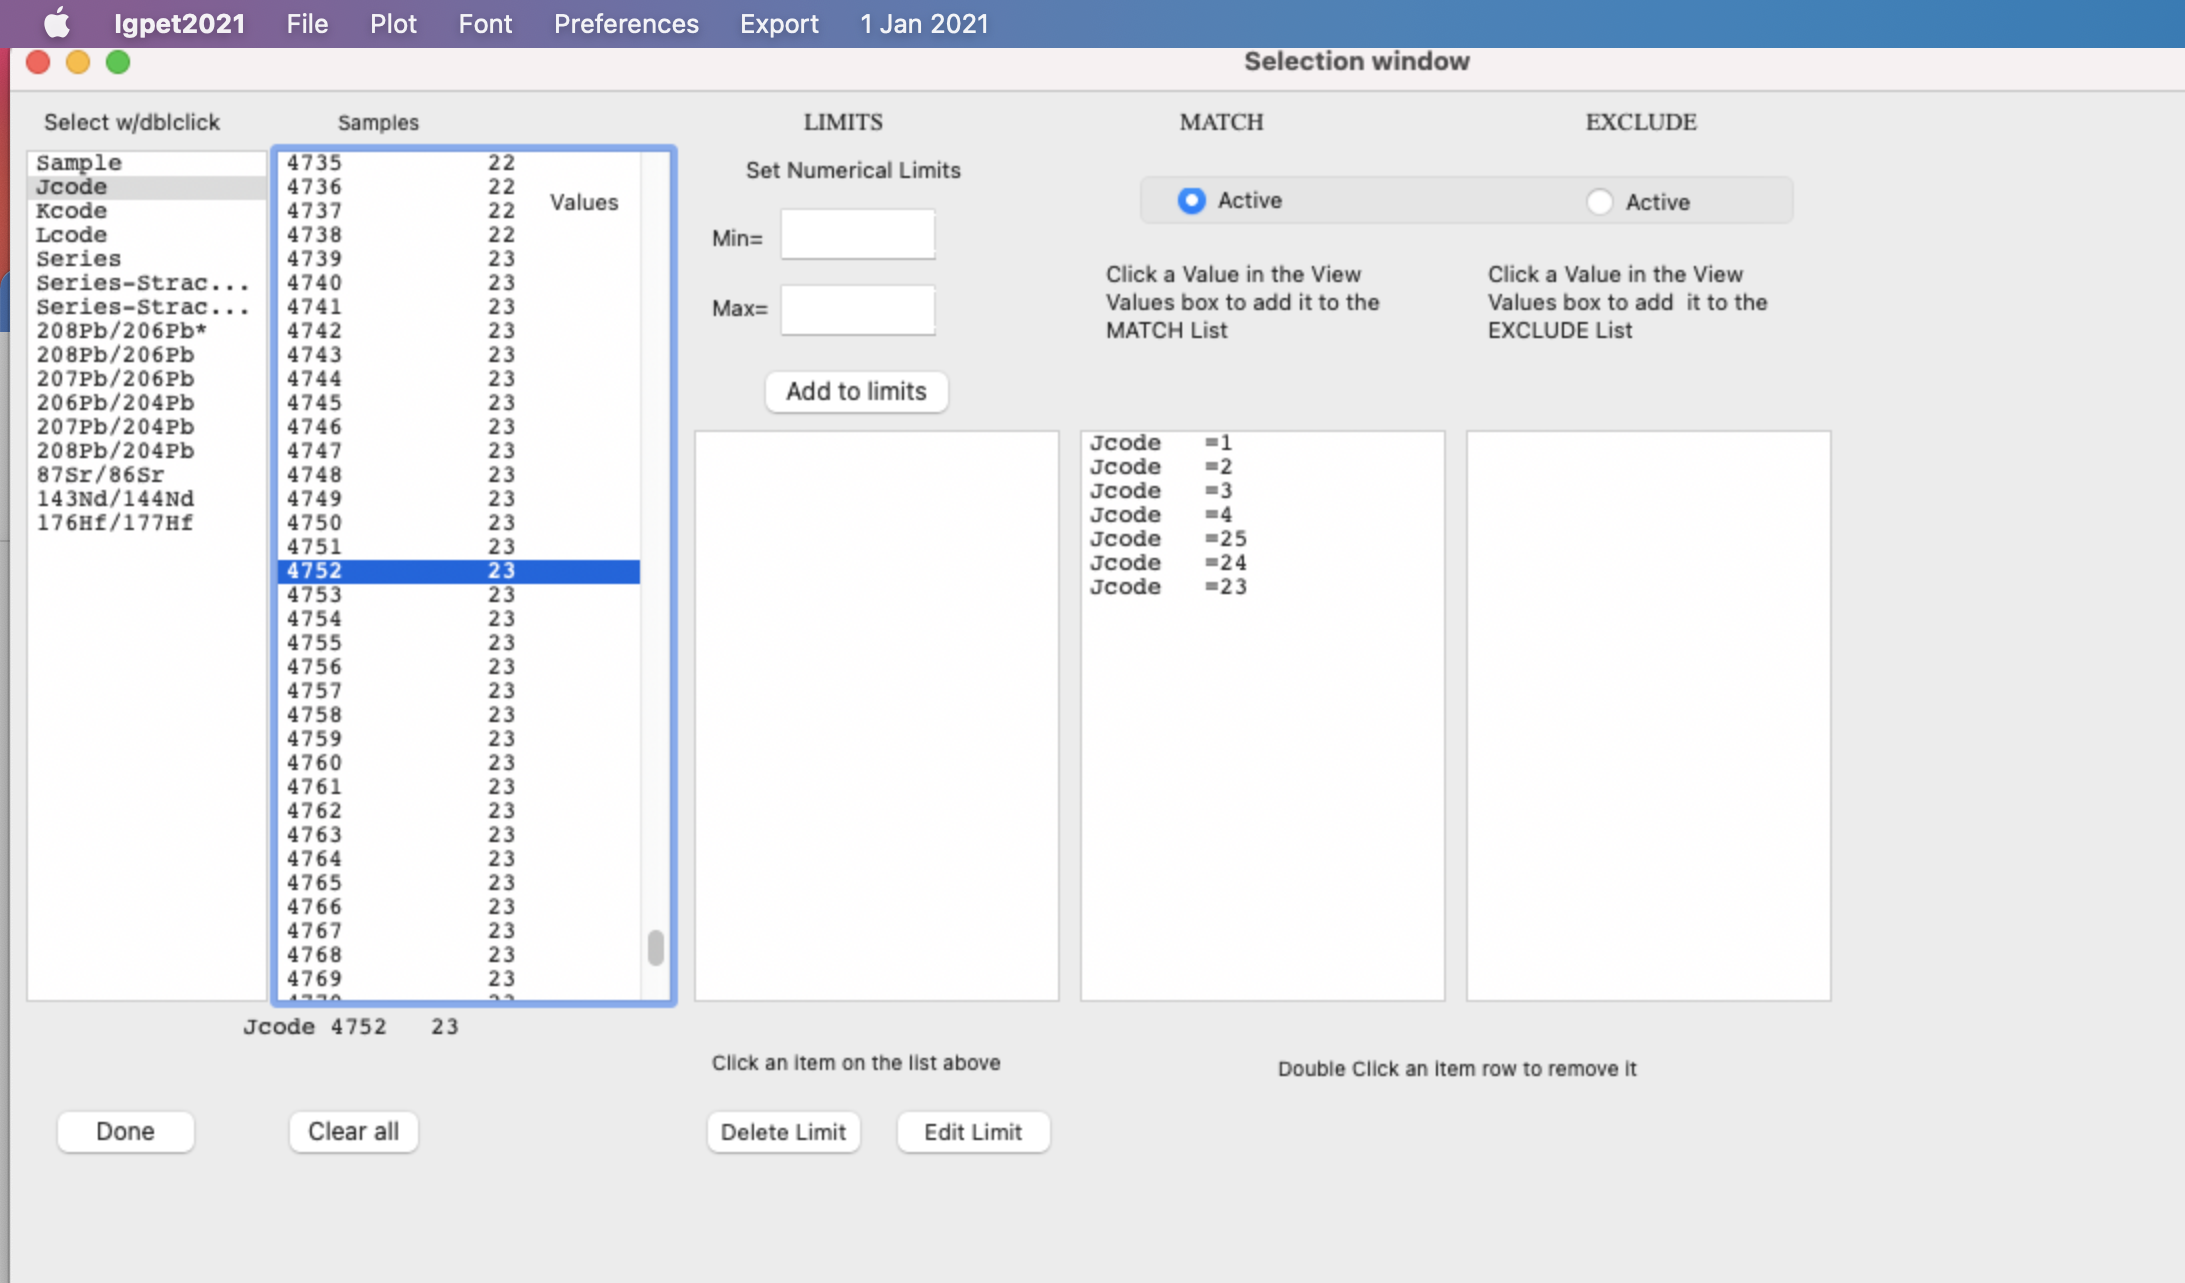
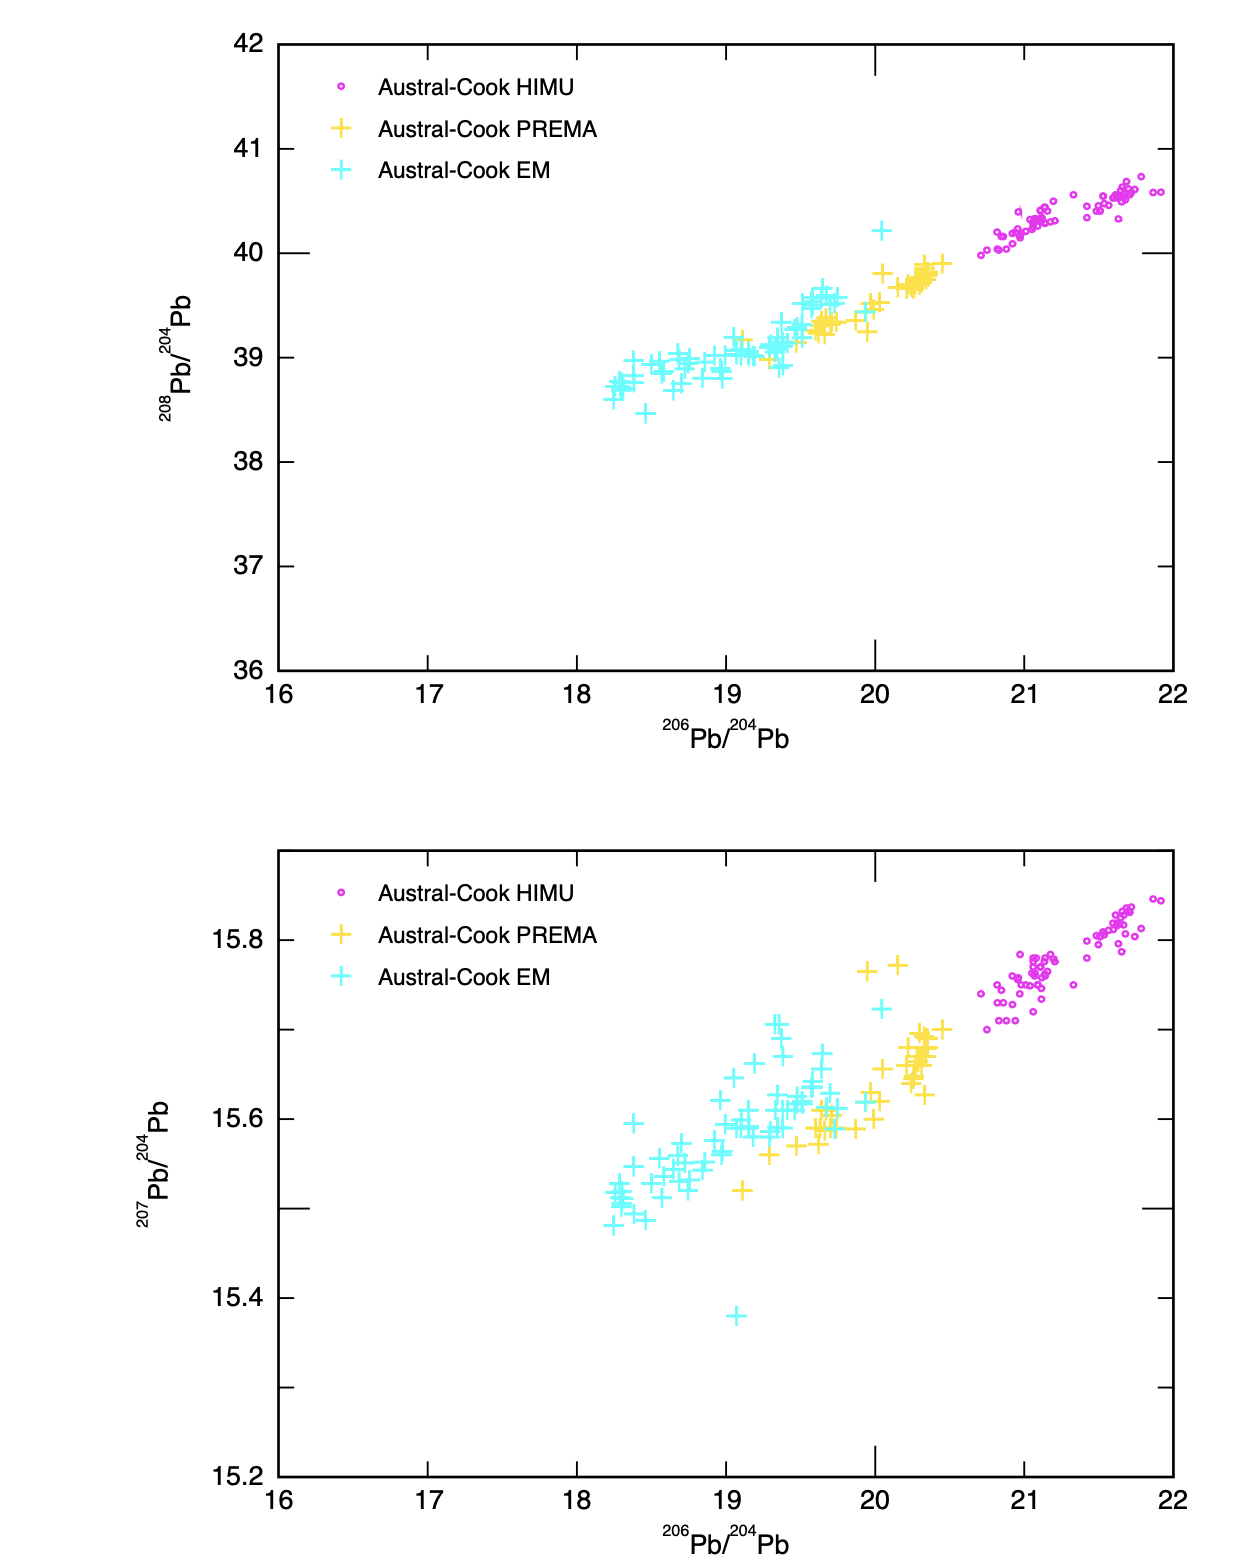
Next, I make the Pb-Pb-Pb plots. I have to refamiliarize myself with the process a bit, and I accidentally end up plotting 208Pb/206Pb the first time. It is easy enough to re-do. To show Austral-Cook endmembers better, I just select groups 23-25 and do not plot MORB here. My sequence is roughly:
- Subselect to match/include JCode = 23,24, 25
- Make X-Y plot with 206Pb/204Pb as the X and 207Pb/204Pb as the Y
- Go to Position, then Aspect, then make sure it is on “PortraitLower”, since 207 is shown below 208 usually (hopefully I am not getting this reversed!). I changed the legend to be inside the diagram now, as it was now off the page.
- Save as pdf, select the “add last diagram + continue” option, which I think is actually worded confusingly. But it just means that the next time you click “save to pdf”, it will be superimposed on whatever you last saved.
- Go to “New Y”. Simply change the “Y” to 208Pb/204Pb. It will show the plot on top of the 207. Do not panic! Go to position again, then aspect, and then select “PortraitUpper”. Now you shold see two plots with the same x-axis, one stacked on top of the other. Select “save as pdf” and choose the “last diagram + finish” option.
This is what you get as a result of the simple process:
Conclusion
How long did it take to make a Sr-Nd plot from Stracke et al. (2021)’s supplementary table 1 with separate groups showing different symbol sizes?
Microsoft Excel: 1.5 hours.
Part of that was due to me familiarizing myself with Excel on Windows 11 and not knowing all the tips and tricks that one should probably know by now.
IgPet: 15 minutes
Note that this includes some time spent data wrangling the 25 groups of samples and working in Excel (overlapping working time). The actual IgPet plotting and exporting took maybe 5 minutes, and I did not alter any of the symbols, font size, design, etc. It’s pretty much ready to edit in Illustrator.
This was done quickly to demonstrate how quickly I could make a plot, but it is not ready to show with my data yet. For that, i just have to make sure all the column headers match. I’ll standardize this next! Note from present day Thi (February 2024): I did NOT standardize this next.